Measuring
Spots, lines, areas, boxes, circles and Delta Ts are measured on mosaics, in the viewer and on the compare page, and on single frames, on the frame page.
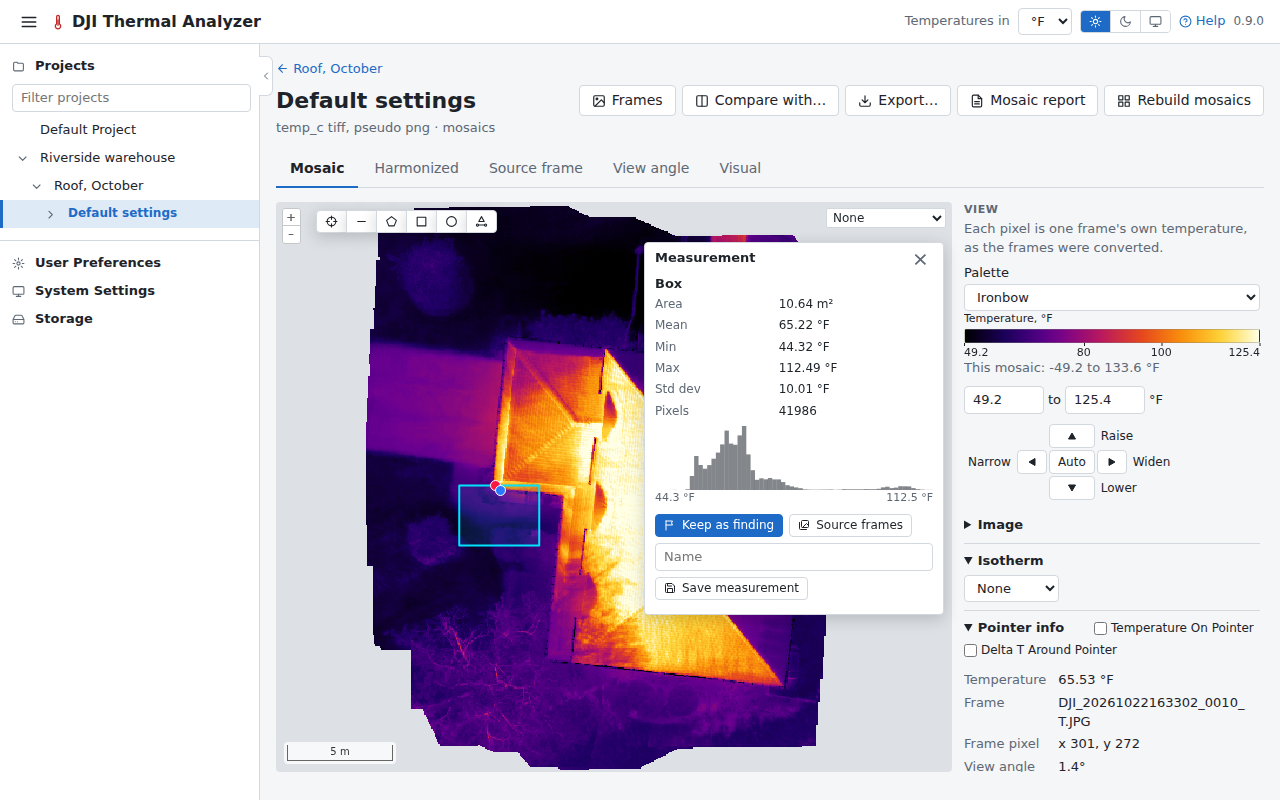
Drawing a shape
The drawing tools are on the map's top edge, beside the zoom buttons. A shape drawn is measured in a card on the map, closed with × or Escape. The card gives the temperature at a spot, or a shape's mean, min, max and standard deviation, the share inside the isotherm, its pixels, and a line's profile or an area's histogram.
On the card:
- Save measurement keeps it, listed in the side panel's Saved measurements.
- Keep as finding, for a spot, an area or a Delta T of a mosaic: see Findings.
- Source frames, for a spot, an area or a Delta T of a mosaic: see below.
Delta T
The Delta T tool, after Circle, compares two spots. Click the first spot, then the second: the tool ends on the second click, and the card gives the line's length, the temperature of each spot (First spot, Second spot, each the temperature of the pixel under it, as the cursor's own readout gives it, so a small hot or cold spot reads true) and ΔT, the second's temperature minus the first's. A Delta T is drawn as a line with a ring at each end. It has no isotherm, and it isn't offered on the Source frame tab or on a visual mosaic, which have no temperatures.
A saved Delta T is listed with its ΔT and both temperatures, for example "ΔT +1.5 °C (20.0 °C → 21.5 °C)", and the CSV gives them in its First spot, Second spot and ΔT columns. Its source frames are those that saw a strip along its line, as wide as a spot's disc, outlined in each frame.
On a frame page, the Thermal/Visual/Both switch shows the frame's visual image in its place or beside it, with the same shapes and the cursor on it, and measures the thermal frame under them.
On the compare page
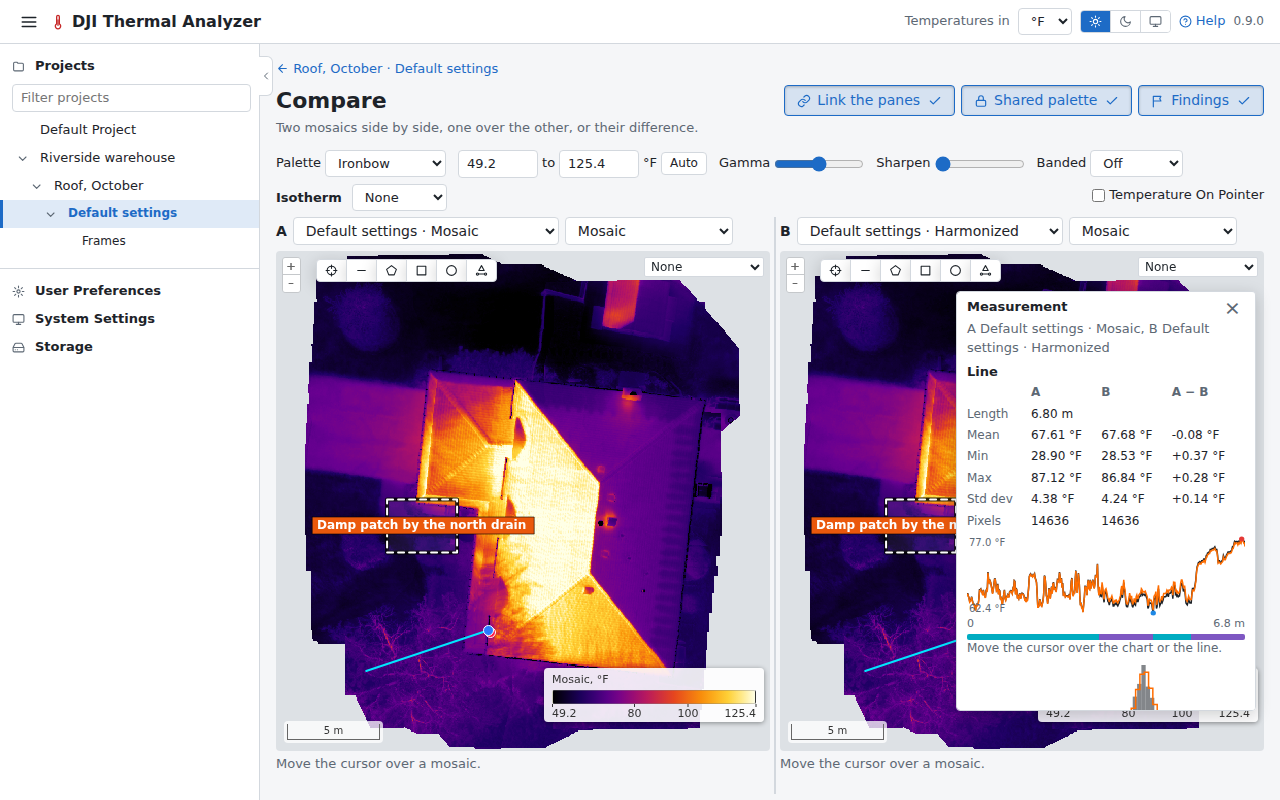
On the compare page each pane's map has the same six tools. A shape drawn in either pane is measured on both mosaics, pane A's and pane B's, whatever each pane shows (its mosaic, the difference or the overlay), and drawn in both panes. Its card, on the pane it was drawn in, names the two mosaics and gives each figure in three columns, A, B and A − B (B's temperatures in A's unit when their units differ); a line's profile draws both curves. Where one mosaic has no data under the shape, or is a visual mosaic of its own with no temperatures, the card gives the other's alone and says why. A pane on a dataset's visual mosaic is measured on its temperatures, as its readout is.
- Save measurement saves it on both datasets, with the name typed, so each one's viewer lists it in its Saved measurements and its CSV (once, when both panes show the same mosaic).
- Source frames, for a spot, an area or a Delta T, opens the frames that saw it in each mosaic, each with Save as finding: see Findings.
A Delta T across the two images
With both panes on a temperature mosaic (not the difference, the overlay or a visual mosaic), Delta T's second spot decides what it measures. Click the first spot in one pane: it is marked in yellow in the other pane too. Then:
- A second click in the same pane measures a Delta T on both mosaics, as the other tools do.
- A second click in the other pane, anywhere on its image, measures a Delta T across the two: the first spot read on its own pane's mosaic, the second on the other's, and ΔT the second's temperature minus the first's (in the first spot's dataset's unit where the units differ). Each pane then shows its own spot alone, numbered 1 or 2, joined by a dashed line across the split (while both spots are in view), and the card, on the second spot's pane, says which spot is on which dataset. In a dataset's viewer, a saved one shows that dataset's spot alone.
Esc lets go of a first spot. Save measurement saves a Delta T across on both datasets, each one's viewer listing it in its Saved measurements as "across to" the other dataset, and its CSV naming that dataset in Across to. It is kept only while both datasets are: removing either one removes it from the other too. It has no source frames, and isn't measured again with other parameters.
The Isotherm, under the panes' palette, is shared by both panes: typed in your unit, it greys the pixels outside it in both temperature mosaics (not the difference or a visual mosaic), and the card gives the share inside it for both.
On a visual mosaic
The dataset of a flight of visual images only has no temperatures. In its viewer, the card of a line gives its length, and that of an area, box or circle its area and perimeter, in metres on the mosaic. They are measured on the mosaic, so they are only as exact as it is (see Mosaics). The card has Save measurement, Keep as finding and Source frames, as on a thermal mosaic, and its saved measurements export as CSV and GeoJSON with their length, area and perimeter. A spot opens the frames that saw it.
Saved measurements
Saved measurements can be compared, measured again with other settings, and exported as CSV and GeoJSON. Each can have a comment, shown in the viewer's list, in the CSV and GeoJSON, and in the mosaic report.
Source frames
The source frames window shows every frame that saw a spot, an area or a Delta T of a mosaic, the one the mosaic used first, each with its time and view angle and the spot marked or the area (or the Delta T's strip) outlined in it, in the thermal frame or, with the Thermal/Visual switch, its visual image.
It opens from:
- Source frames on a measurement's card;
- a spot or an area drawn (or a click) on the Source frame or Visual tab;
- a saved measurement's;
- on the compare page, Source frames on the card of a spot, an area or a Delta T drawn on a pane's map.
A finding can be kept from it. Mosaics built before version 0.5.0 list only the frames they used: build them again to list every frame.