Compare
The compare page shows two datasets side by side, one over the other, or their difference, from any flight, the project's listed first. Open it with Compare with… in the viewer's header or on a dataset's card.
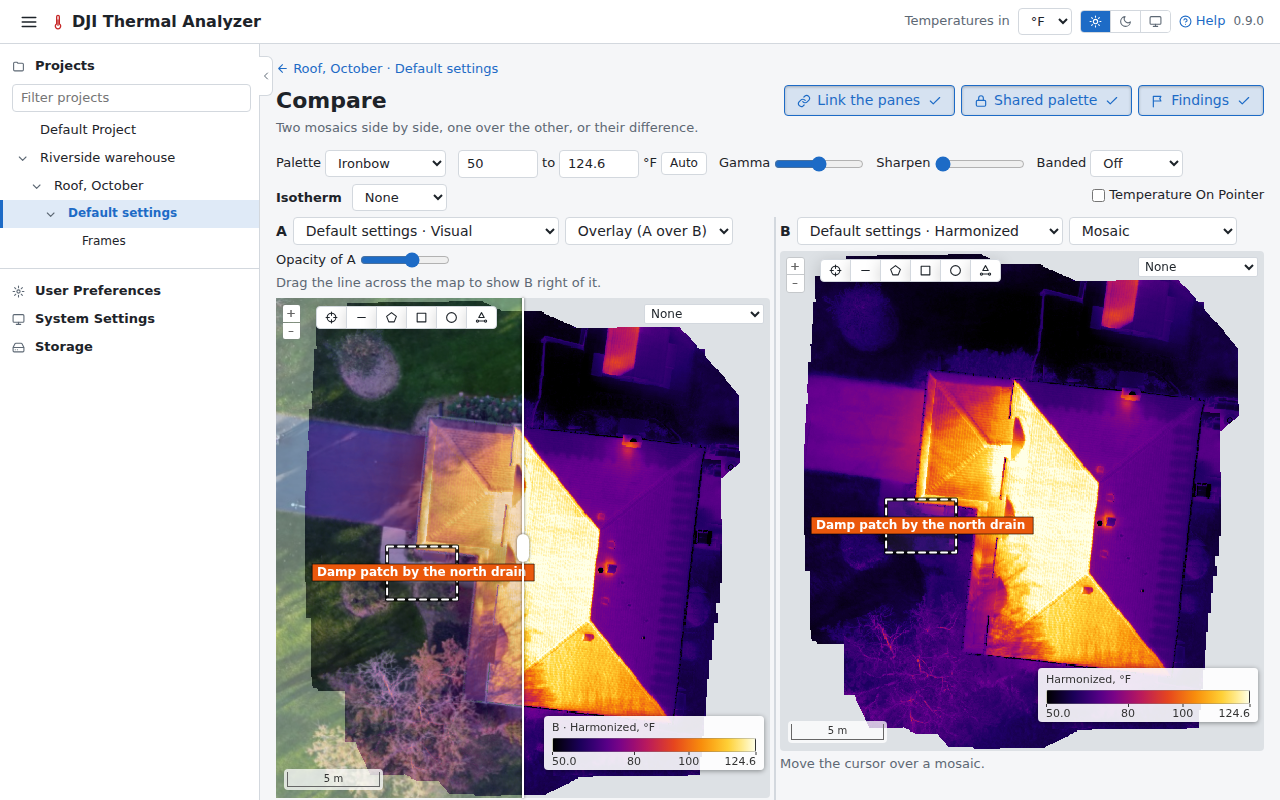
- A pane shows a dataset's mosaic, or its visual mosaic. The dataset of a flight of visual images only is listed with its visual mosaic alone: its pane has no values under the cursor, a spot or an area drawn on it opens its visual photos, and it has no difference. An imported dataset is listed with its WebODM tab, or its visual mosaic alone; a spot or an area drawn on it opens the photos found from its task's cameras.
- Overlay (A over B) draws pane A's mosaic over pane B's in one pane, faded with an opacity slider and cut at a swipe line dragged across it: visual over thermal, or two thermal mosaics.
- The difference of two mosaics, in one pane.
The header's Link the panes, Shared palette and Findings stay pressed in, with a check, while they are on. The palette bar above the panes has the range, Gamma, Sharpen and Banded, with its bandwidth while it is on: for both panes while the palette is shared, else for each pane.
Under the cursor
The cursor is marked in the other pane too, and the line under each pane gives the values there once it rests. In a pane of a mosaic: its Temperature, and under it ΔT, that pane's temperature minus the other's, in your unit: A − B under pane A, B − A under pane B, so the two give it both ways (left out where either mosaic has no temperature there). In the difference and in the overlay: A and B, and the difference's A − B.
Temperature On Pointer, at the right of the Isotherm row, shows a small tip beside the cursor once it rests, in the pane it is in: that pane's temperature and its ΔT; in the difference, A − B (what it draws); in the overlay, A, B and its pane's ΔT. The box is the one in the viewer's and the frame page's Pointer info (see Mosaics › Pointer info), and ticking it on one page ticks it on the others.
Each pane draws its flights' findings. The measuring tools on each pane's map (Spot, Line, Area, Box, Circle and Delta T) measure a shape on both mosaics at once, with A − B, in a card that saves it on both datasets and opens its source frames; an isotherm is shared by both panes. A Delta T's second spot clicked in the other pane measures a Delta T across the two images. See Measuring › On the compare page.